Sample Acid-Base Titration Experiment
Electronic Measurement and Data Collection in the Chemistry Laboratory
Hands-on Experiment - pH Titration Curve
In this experiment, you will generate a titration curve for an unknown acid or base. Using a drop counter, you will add titrant and display a plot of pH vs. drops on the MeasureNet™ workstation.
Procedure
Calibrating the pH electrode
1. Move the black band on the pH electrode to uncover the hole in its side. Mount the electrode in a vertical position with a universal clamp on a ring stand (not the same one holding the burets), and connect it to the workstation. Place a waste beaker under the electrode and rinse the electrode with distilled water, then gently touch a Kimwipe to the electrode tip to remove the remaining drop of water. Pour a sample of a standard buffer solution into a disposable cup. Lower the pH electrode into the solution.
2. Press MAIN MENU on the workstation. A list of measurement types will appear on the screen. (Make a note of the station number listed at the top of the screen.) Press the function key listed for pH, then the function key for pH versus drops, and then press CALIBRATE. Follow the instructions on the screen, which will prompt you first to enter the temperature (if not known, just assume ~22°C), then to enter the known pH of the standard solution, and finally to monitor the pH displayed. Be sure to press Enter after the pH reading becomes steady. You are performing a single point calibration, so press F1 when prompted by the message on the workstation screen. Press DISPLAY and note the pH value on the workstation screen. If it is not within 0.02 pH units of the actual pH of the standard buffer solution, you should redo the calibration.
Titration Experiment
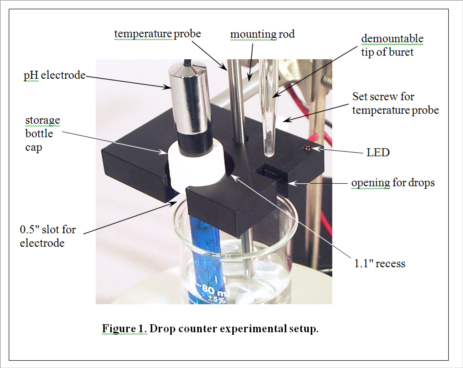
(Consult Figure 1 on the last page for a picture of the experimental setup.)
3. Select an unknown solution, which will contain either a mono- or diprotic weak acid, or a mono- or dibasic weak base. Pipet 25 mL of the unknown solution into a 50-mL beaker equipped with a stir bar. Place the beaker on the center of the stir plate. Place the pH electrode in the holder in the drop counter, and lower it into the beaker (near the wall of the beaker to avoid the stir bar) so that the protective shield rests lightly on the bottom of the beaker. Clamp the drop counter to a ring stand. Turn on the stir plate so that the stir bar is turning at the lowest sustainable speed. Note the initial pH of the solution. Based on this pH, decide which titrant (HCl or NaOH) you will use to titrate the solution. Fill a 50 mL buret with the appropriate titrant.
4. Position the buret containing the selected titrant so that its tip is over the appropriate opening in the drop counter, making sure that this is also over the beaker, probably near the wall opposite the pH electrode. It gets a little crowded here, and you will need to take care not to change the position of the beaker in the center of the stir plate. Don't let any titrant fall into the sample yet! When everything is arranged as in Figure 1 (except the temperature probe, which we aren’t using in this experiment), begin the titration by pressing START/STOP on the workstation. The station will first ask you to enter the starting reading on the buret. It need not be exactly 0.00 mL. Just read what it is and enter the appropriate value. The station display will now show the pH and the number of drops counted, 0 so far. Carefully turn the stopcock on the buret to begin adding the titrant. The red LED on the drop counter will flash each time a drop is counted. Try to maintain a rate of approximately 1 drop per second. A flow restrictor is used in the stopcock to make this easier to accomplish. Your only duty while the titration is running is to monitor the drip rate and make small adjustments of the stopcock if needed.
5. When you have followed the titration far enough, press START/STOP to stop the titration. The station will now ask you for the final volume reading on the buret. Read and enter the value.
6. Print your titration curve. Press FILE OPTIONS, read the menu that appears, and press the function key listed for PRINT DATA (standard). Enter the number of copies to be printed, and press ENTER. Your plots will appear on the printer attached to the PC. They will be labeled at the top with your station number.
7. Use the printed plot to estimate the pKa(s) for the substance you titrated, then ask the instructor to compare your results with what was expected for your unknown.