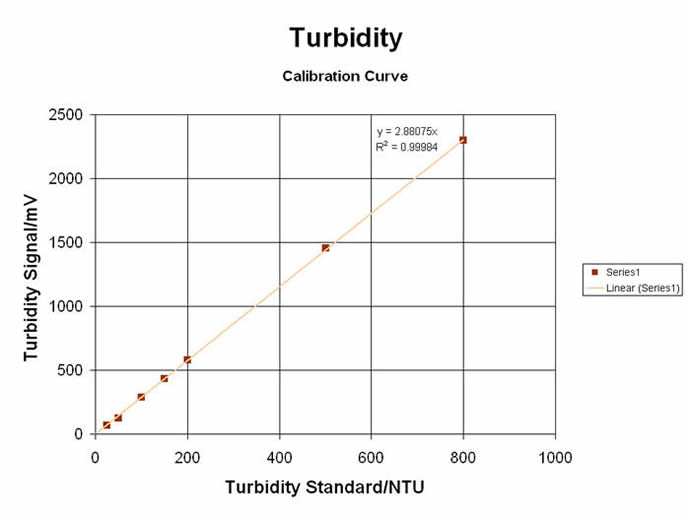
#3) TURBIDIMETRIC / NEPHELOMETRIC LIGHT-SCATTERING SPECTROMETRY
The “Colorimeter” can also be used in the “Turbidometer” mode… or more precisely, as a “Nephelometer”, since nephelometry uses a Near-IR LED (@ 880nm) to measure the SCATTERED light at a 90° angle from the light source, as it is done on the MeasureNet unit. Tests can be made on sample solutions that have existing particulate suspensions… or a reaction can be made to produce a range of particulates for relative and direct measurements. Originally used for Clinical Chemistry applications, Turbidometry/Nephelometry can be applied to a wide range of curriculum subjects… from Organic Synthesis & Analytical Chemistry to Environmental & Biochemistry Labs. Some of these unique and educational labs are shown here:
Turbidity (“Nephelometry”) for Kinetic & Relative Comparison at Single values:
• Environmental Testing of “Settleable Solids” for River / Stream & Estuarial Waters
• Reducing Sugars by Benedict’s Test... great for Diabetics, Atkins-Diets and all the rest!
• Collect some of the DUST from your “Air”… is it okay to breathe or is something there?
• Rate of Reaction of Silver Ion + Chloride Ion to form AgCl precipitate… Kool Kinetics!
• The classic Princeton “Nassau Clock” Reaction… makes for a great teaching Lab attraction!
• Measurement of Yeast Growth in Beer… is it fermenting slow or in high-gear?
Have you ever wanted to look in from your office or remote location to check on the progress of your lab students or an experiment you are running? Or what about sharing experiment data from this morning’s lab with rural student miles away with no lab access? With MeasureNet’s new Remote Monitor software, you can— whether you’re down the hall or across the country.
Designed with STEM partnerships and outreach activities in mind, Remote Monitor gives institutions without MeasureNet a chance to participate through the graphical viewing of acquired data files and the analysis of collected data via most any statistical or spreadsheet software. It also allows lab directors, instructors, and teaching assistants to monitor their MeasureNet networks from different physical locations.
Any station on any network can be monitored live or its saved files can be downloaded to any PC running Remote Monitor. Network chat boxes make it easy for teaching assistants to communicate with each other or with the lab manager. Remote Monitor also enables MeasureNet’s Cincinnati offices to quickly troubleshoot a network anywhere in the world as long as it is connected to the Internet. With appropriate IDs and passwords, a collaborating institution can have access to partner real-time lab experiments or saved data for research or outreach activities. Remote Monitor installs on any Windows-based PC connected to the Internet and doesn't require additional software or MeasureNet hardware.
MeasureNet Technology Ltd. manufactures patented, network-based data acquisition interfaces for science teaching laboratories. It is a spin-off of the University of Cincinnati's Department of Chemistry and is headquartered in Cincinnati, Ohio. Measurenet's award-winning, PC-reducing design helps reduce laboratory maintenance and operational costs while giving students access to high quality shared UV-vis spectroscopy, gas chromatograph connectivity, and an array of innovative probeware. Its acclaimed intuitive design provides improved transparency to enable better science-focused, not technology-focused, learning. Winner of the Ohio Governor's Award For Excellence in Energy Efficiency, MeasureNet networks are found in universities, community colleges, high schools, and vocational training centers across the United States and around the world.
 On Sept. 26 the U.S. Department of Education announced that 97 Hispanic-Serving Institutions (HSIs) are the recipients of awards given through the Hispanic-Serving Institutions Science, Technology, Engineering and Mathematics, and Articulation Programs (HSI STEM and Articulation Programs). The program had about $100 million for 109 grants that will support the development of articulation between two and four year institutions or enhance science, technology, engineering and math (STEM) programs at HSIs. The grant funds may be used for:
- scientific or laboratory equipment for teaching
- the construction or renovation of facilities
- purchasing educational materials
- academic tutoring or counseling programs
- teacher education
- student support services.
More....
QUANTUM FLUORESCENCE & KINETIC SPECTROMETRY
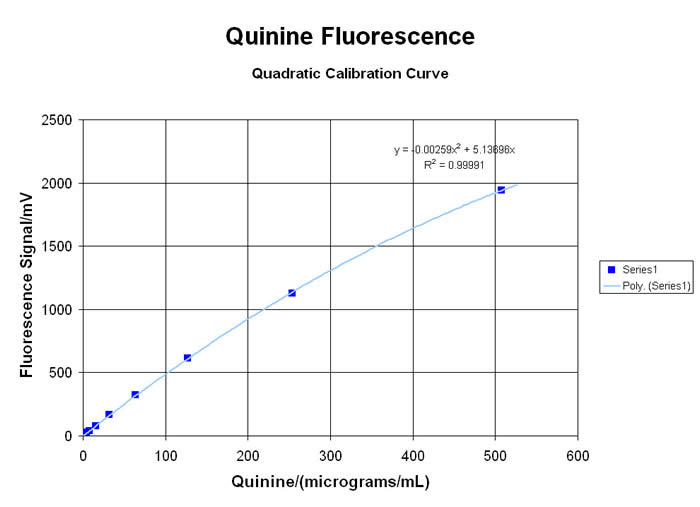
Many types of organic molecules will exhibit a VISIBLE fluorescent “emission” when exposed to high energy ULTRA-VIOLET light to create the “excitation”. This spectro-chemical response is due to the interaction of the energetic UV photons with the loosely-held pi-electrons and other “labile” functional groups in aromatic, olefinic, alkaloidal, xanthinoid and poly-cyclic compounds… and there are many important applications for this little-understood, rarely-taught, under-utilized technology. Using the newest in LED technology, the MeasureNet “Colorimeter” has several “excitation” sources available… with the 375nm UV-LED providing the most useful range of responses for relative fluorescence analyses (since it is very close to the classic 366nm long-wavelength UV from a mercury lamp)… although several alternate user-defined Wavelengths are available from a growing list of LED sources. Please inquire for more information!
When used in the “Fluorometer” mode, the detector is situated at a 90° angle from the UV LED Source, to generate TRUE fluorescent “emission” data without potential interference from the “excitation” wavelength. Laboratory exercises for both qualitative comparisons and quantitative analysis of many materials are possible with the MDBC-138 Dual-Beam Colorimeter. Some applications in Organic Chemistry, Analytical Sciences, Biology/Biochemistry, Environmental and Nutritional Science programs, are highlighted here:
UV-LED Fluorometry for Single-range EMISSION Values:
• “Zap” UV against Chlorophyll from things that Grow… and see what makes it Glow
• The Highlights of Highlighting Markers: How bright is bright?
• Evaluation of Cigarette Second-Hand Smoke: Nicotine for the Masses in your Breathing Gases?
• Analysis of Alkaloid Materials like Quinine
• Measure Amino Acids in “Energy Drinks”… Are their labels Accurate
• Check Ground-Water “Plumes” with Fluoresceine… Water-Table extracts will also be green!
A typical colorimeter is usually a simple, single-beam optical system to measure “color” in the VISIBLE Spectrum of light and provide ABSORBANCE data at a single wavelength. These systems can cost $1,000 or more for stand-alone colorimeters that merely provide simple ABS data… unless you consider the MeasureNet Model MDBC-138 true Double-Beam, Multi-Functional “Colorimeter” based on a unique set of LEDs (Light-Emitting Diodes)... for under $500! The MeasureNet “Colorimeter” is actually FOUR (4) instruments in ONE (1) compact and rugged box… and works as a colorimeter (to make Beer’s Law Curves for VISIBLE Wavelengths), a UV fluorometer (to demonstrate fluorescence & quenching in certain organic molecules), a turbidometer (to measure the turbidity of particulate & colloidal suspensions) and a phosphorimeter (to analyze the phosphorescence [“glow”] of specific materials).
#1) BEER’S LAW ABSORBANCE & KINETIC SPECTROSCOPY
This unit can be used as a “simple” Colorimeter to demonstrate Beer’s Law using three (3) high-output VISIBLE Light LEDs at 472nm (BLUE), 525nm (GREEN) and 630nm (RED); which cover over 75% of the classic General Chemistry and Analytical Chemistry Laboratory experiments that teach spectrophotometric measurements. The wavelength coverage of these LEDs allows highly accurate relative measurement of almost all the ROYGBIV Colors. The disposable & unbreakable 10mm pathlength, near-UV plastic cuvettes included with the “Colorimeter” can be used from ~300nm (in the near-UV) to over 1000nm (in the near-IR) for analytical measurements… and come with sealing caps to preserve prepared solutions for future tests. Some of the popular Laboratory experiments for your Academic Lab curriculum programs Gen Chem, Analytical or Student Research are:
Red / Blue / Green Colorimetric ABS Data for Beer’s Law plots:
• Test for Mineral IRON in your food… check your Cereals, Breads and more
• Unsaturated FATS can be easily seen… just get a purple Color using some IODINE!
• Evaluation of Nutritional Food Proteins… React it to get a “BLUE” and see what can be seen!
• Consistency of M&M and Skittles Candy Colors: Is the "blue" true blue or “faux” to you!
• Changing “Colors” of some pH Dyes… [H+] makes them look *new* to our eyes!
• General Colorimetric Assay… for ANION (X, PO4, SO4, NO3, NO2, etc)
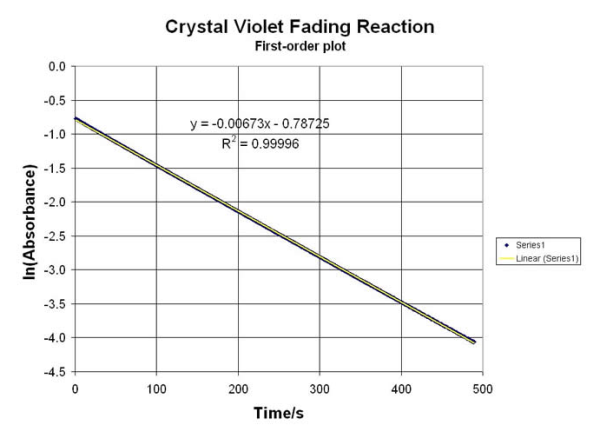
The MDBC-138 is a TRUE Double-Beam Optical System… and provides a reference cell to “blank” out the reagents used to create a very stable ABS reading for several Organic Reactions. Data from these Labs can be used to calculate rate constants, equilibrium factors and reaction conditions (for thermal, ionic and electrochemical variables). This is a MUST for making accurate kinetic experiment tests. A few of them from our “Library” include:
Dual-Beam ABS Data for Kinetic Measurements:
• The Iodine Test for Starches… just Hydrolyze with Amylaze to get a Kinetic Rate
• Perform REDOX “Clock” Reactions
• pH-based Hydrolysis of p-nitrophenylacetate Ester
"Burner"
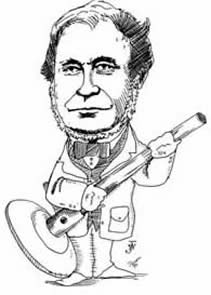
Robert Wilhelm Bunsen (1811-1899). German chemist. Professor of chemistry at the universities of Kassel (1836), Marburg (1841) and Heidelberg (1852-1889), Bunsen is perhaps best known for his work on spectrum analysis (1860), done in collaboration with the German physicist, Gustav Kirchhoff, and their subsequent discovery of the elements cesium (1860) and rubidium (1861). He also did notable work on the chemistry of organoarsenic compounds (1837-1842),the laws of photochemistry (1855-1867), and the refinement of gas analysis (1857). Known to students of general chemistry for his introduction of the tubular laboratory gas burner in 1855, Bunsen was a prolific inventor of chemical apparatus, including the Bunsen carbon battery (1841), the grease-spot photometer (1843), the hydrogen chloride actinometer (1857), and an improved ice calorimeter (1870).
Courtesy of Professor William Jensen, Oesper Chair of the History of Chemistry and Chemical Education, University of Cincinnati
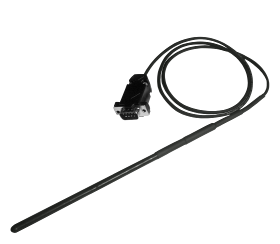
What makes the MeasureNet temperature probe unique? Two features in combination are what set this probe apart from other stainless-steel sheathed probes on the market; its rapid four-second response time and its acid resistant coating. These two characteristics are essential for conducting experiments like thermometric titrations and freezing point depressions in the general chemistry lab.
Before I go into the details of how we achieve these two essential characteristics, lets examine the most common temperature sensor options found in the chemistry lab. Listed in the table below are the three types most commonly used sensors and their properties:
| Attribute |
Thermocouple |
RTD |
Thermistor |
| Cost |
Low |
High |
Low |
| Temperature Range |
Very wide
-350oF
+3200oF |
Wide
-400oF
+1200oF |
Short to medium
-100oF
+500oF |
| Interchange ability |
Good |
Excellent |
Poor to fair |
| Long-term Stability |
Poor to fair |
Good |
Poor |
| Accuracy |
Medium |
High |
Medium |
| Repeatability |
Poor to fair |
Excellent |
Fair to good |
| Sensitivity (output) |
Low |
Medium |
Very high |
| Response |
Medium to fast |
Medium |
Medium to fast |
| Linearity |
Fair |
Good |
Poor |
| Self Heating |
No |
Very low to low |
High |
| Point (end) Sensitive |
Excellent |
Fair |
Good |
| Lead Effect |
High |
Medium |
Low |
| Size/Packaging |
Small to large |
Medium to small |
Small to medium |
(Table is courtesy of The Enginneering ToolBox)
One sensor not mentioned is the solid-state temperature sensor. We selected the LM35CH solid-state sensor for the MeasureNet temperature probe for three reasons; its response time, temperature range, and its easy interface to the measurement stations.
In designing the MeasureNet temperature probe, we focused on two characteristics; response time and acid resistance. The response time is particularly pertinent when selecting a temperature probe. When trying to measure a fast thermal reaction with a temperature probe that has a slow response time, as they say, garbage-in equals garbage-out! The other consideration is acid resistance, which impacts the probes durability.
This is where MeasureNet's acid resistant and thermally conductive coating comes in to play. It maintains its superior protective properties over long periods of time with minimal impact on its response time. It has passed extensive tests for protecting the probe in hydrochloric, phosphoric, sulfuric and nitric acid solutions. Most of the temperature probes on the market designed for rugged lab use embed the temperature sensor in a stainless-steel sheath. Although this gives the probe superior mechanical strength and some protection against weak acids, it slows the response time of the probe to 8-30 seconds depending on the sensor used and the design of the sheath. MeasureNet designed the temperature probe with the end user in mind, students in the chemistry lab.
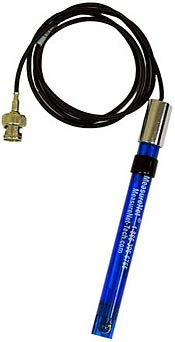
MeasureNet's ElectroJelly™ pH electrode has been designed with students and the chemistry teaching lab in mind. What is ElectroJelly™? It is a solid material with highly concentrated salt (most times it is KCl) that can effectively hold reference electrode electrolytes and prevent it from contamination by sample back-flow. The ElectroJelly™ filled (sealed) electrodes have a longer life and need less calibration than regular gel filled electrodes, saving time and money. Two other features unique to the MeasureNet pH probe are the SilverCap™ for noise reduction while handling the probe, and the epoxy body design uses holes instead of tabs too better protect the glass bulb from the rough handling of students. You use the pH probe with our Drop Counter for pH titrations.
ElectroJelly™ pH Electrode Features:
- Superior Stability
- Fast response
- Minimum sodium (alkaline) error
- pH 0 -14 full range measurement
- Special internal fill offers full range linear temperature compensation
- Very low sensor glass membrane resistance
- Zero and Isopotential: ~pH 7
- Unique Glass Bulb protection design
MeasureNet's ElectroJelly™ probes are ideal for undergraduate research projects. The probe's stability and long life span are ideal for 24/7 monitoring applications and experiments involving temperature cycling. If pH titrations are an fundamental part of your curriculum or research, the ElectroJelly™ probes stability and rapid response time makes it the perfect choice.

Researchers expand capabilities of miniature analyzer for complex samples
(PhysOrg.com) -- It’s not often that someone can claim that going from a positive to a negative is a step forward, but that’s the case for a team of scientists from the National Institute of Standards and Technology (NIST) and private industry. In a recent paper,* the group significantly extended the reach of their novel microfluidic system for analyzing the chemical components of complex samples. The new work shows how the system, meant to analyze real-world, crude mixtures such as dirt or whole blood, can work for negatively charged components as well as it has in the past for positively charged ones.
Electronic Measurement and Data Collection in the Chemistry Laboratory
Hands-on Experiment - pH Titration Curve
In this experiment, you will generate a titration curve for an unknown acid or base. Using a drop counter, you will add titrant and display a plot of pH vs. drops on the MeasureNet™ workstation.
Procedure
Calibrating the pH electrode
1. Move the black band on the pH electrode to uncover the hole in its side. Mount the electrode in a vertical position with a universal clamp on a ring stand (not the same one holding the burets), and connect it to the workstation. Place a waste beaker under the electrode and rinse the electrode with distilled water, then gently touch a Kimwipe to the electrode tip to remove the remaining drop of water. Pour a sample of a standard buffer solution into a disposable cup. Lower the pH electrode into the solution.
2. Press MAIN MENU on the workstation. A list of measurement types will appear on the screen. (Make a note of the station number listed at the top of the screen.) Press the function key listed for pH, then the function key for pH versus drops, and then press CALIBRATE. Follow the instructions on the screen, which will prompt you first to enter the temperature (if not known, just assume ~22°C), then to enter the known pH of the standard solution, and finally to monitor the pH displayed. Be sure to press Enter after the pH reading becomes steady. You are performing a single point calibration, so press F1 when prompted by the message on the workstation screen. Press DISPLAY and note the pH value on the workstation screen. If it is not within 0.02 pH units of the actual pH of the standard buffer solution, you should redo the calibration.
Titration Experiment
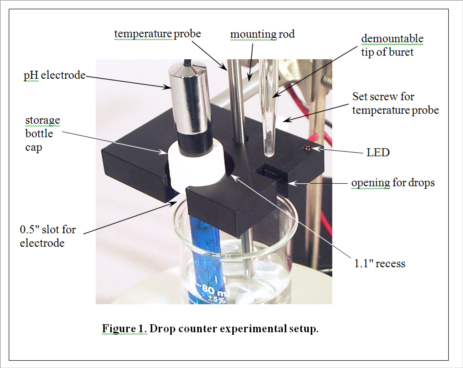
(Consult Figure 1 on the last page for a picture of the experimental setup.)
3. Select an unknown solution, which will contain either a mono- or diprotic weak acid, or a mono- or dibasic weak base. Pipet 25 mL of the unknown solution into a 50-mL beaker equipped with a stir bar. Place the beaker on the center of the stir plate. Place the pH electrode in the holder in the drop counter, and lower it into the beaker (near the wall of the beaker to avoid the stir bar) so that the protective shield rests lightly on the bottom of the beaker. Clamp the drop counter to a ring stand. Turn on the stir plate so that the stir bar is turning at the lowest sustainable speed. Note the initial pH of the solution. Based on this pH, decide which titrant (HCl or NaOH) you will use to titrate the solution. Fill a 50 mL buret with the appropriate titrant.
4. Position the buret containing the selected titrant so that its tip is over the appropriate opening in the drop counter, making sure that this is also over the beaker, probably near the wall opposite the pH electrode. It gets a little crowded here, and you will need to take care not to change the position of the beaker in the center of the stir plate. Don't let any titrant fall into the sample yet! When everything is arranged as in Figure 1 (except the temperature probe, which we aren’t using in this experiment), begin the titration by pressing START/STOP on the workstation. The station will first ask you to enter the starting reading on the buret. It need not be exactly 0.00 mL. Just read what it is and enter the appropriate value. The station display will now show the pH and the number of drops counted, 0 so far. Carefully turn the stopcock on the buret to begin adding the titrant. The red LED on the drop counter will flash each time a drop is counted. Try to maintain a rate of approximately 1 drop per second. A flow restrictor is used in the stopcock to make this easier to accomplish. Your only duty while the titration is running is to monitor the drip rate and make small adjustments of the stopcock if needed.
5. When you have followed the titration far enough, press START/STOP to stop the titration. The station will now ask you for the final volume reading on the buret. Read and enter the value.
6. Print your titration curve. Press FILE OPTIONS, read the menu that appears, and press the function key listed for PRINT DATA (standard). Enter the number of copies to be printed, and press ENTER. Your plots will appear on the printer attached to the PC. They will be labeled at the top with your station number.
7. Use the printed plot to estimate the pKa(s) for the substance you titrated, then ask the instructor to compare your results with what was expected for your unknown.